What Story are you interested in telling?
I’d like to know where the money form the music festivals held in Austin go. From everyone that we have heard speak it seems pretty clear that musicians make net to nothing, so if they’re not getting the money, then who is? The music festivals I would like to focus on most would be ACL and, of course, SXSW.
What topic do you want to investigate?
I would like to figure out what areas of industry the money goes to. Is it the bars, venues, restaurants or food trucks? Pedi-cabs, maybe?
Do you have an interesting lead to follow?
Trei and Skip mentioned that the economic council of Austin could have the data about where the musical festival revenue goes so I am starting research into that. The is also the Program Operating Budget on the Austin Data site that shows where the city allocates fund.
What would be the best way to tell that story?
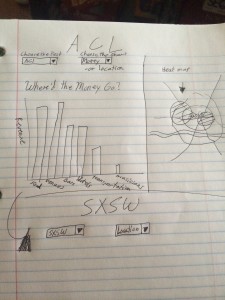
I think an interactive chart that shows what industries benefit most and by how much. Users could choose a festival and the chart would adjust accordingly. If possible, it could also list the top grossing businesses within each industry. Or show a heat map of which parts of town do the best and which parts suffer.
Who are your users?
The city of Austin, the music community in Austin and anyone interested in the music festival or economic aspect of the city.
Where are your users?
A majority of my users would be in the Austin area but it could really be anyone who has an interest int he city or who attends the chosen music festivals.
What questions might they have?
What industries benefit most from the music festival? How much f=do the musicians make? Why doesn’t more of the revenue go to the musicians?
Which do you think are most important?
I think it is most important to look at where the money is going and why the musicians aren’t seeing more of it.
How would you know if the story was successful?
I would like to measures how many page visits the site receives and how many clicks the chart receives.
How are you going to measure that?
I would like to set up some kind of mechanism that will keep count of the page visits and number of clicks. Page visits can be measured through google analytics.
What do you need to tell the story that way?
I will need data on the revenue amounts of local businesses during the music festival times.
What type of technology or tools will help you tell the story that way?
I believe javascript and jQuery can be used to create the interactive chart.
Is it really worth that level of effort? Is there a simpler way.
To tell this story you need that data no matter what. Whether you tell it in words, an info graphic or an interactive chart, you need the data. With that type of data, I believe the best way to tell the story is with something visually appealing that users can interact with.
