I believe that for a city like Austin, one possessing a robust local music scene as well as a density of popular venues that has proven incredibly attractive to touring acts, the question of how changing neighborhood geography, demographics and expectations are affecting venues is an important one.
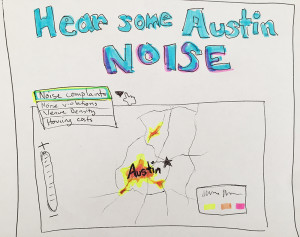
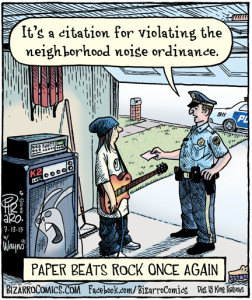 The story I hope to tell is one concerned with the sharp uptick in noise complaints levied against Austin music venues in recent years.
Austin has been facing a rapidly changing housing market. Prices are shooting skyward and neighborhoods are expanding to accommodate the influx of tech-sector employees.
The topic I’d like to investigate is whether the city’s expansion of high-price, high-end downtown housing intersects with the increase in noise complaints for those areas.
Do I have a lead? Austin collects excellent data on noise complaints and noise ordinance violation. These are available on the city’s data site as well as the site for non-emergency police calls, 3-1-1. Housing costs and rising housing prices are also documented.
What is the best way to tell the story? While our friends at Vox did call attention to the fact that maps have been sometimes overused in data journalism, I feel that a map showing the similarities between areas of rising housing costs, or just rising population density, and areas seeing the most noise complaints would be the easiest and most memorable method.
Who are my users? Those most interested in this story would probably be musicians and venue owners, though Austin’s population is quite socially conscious and many would probably care to see the data.
Where are they? Though this might garner some attention outside of the city, most interested parties would be in Austin and the surrounding area.
What questions might they have? If I only had data on noise complaints I think one of the first questions would be, does this have anything to do with the changing housing market/layout in Austin? Which is why I’d like to include that information. This is also the most important question I think they would have.
I would know that the story had been successful if it was shared heavily on social media amongst Austin’s citizens or those with interests in the city’s music scene. I would measure that using some form of google analytics or provided social media tracking.
In order to tell the story this way I will need an organized dataset showing venue-related 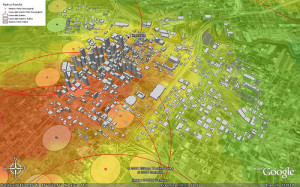 noise complaints for several years going back from the most recent available. I will also need datasets relating to housing cost and neighborhood populations for those same years.
The technology and tools I need are mostly related to data analysis, Excel, etc., though I will need to find good mapping technology. A heat map would probably be the best visualization.
I think this story is worth the effort because Austin’s venues are so much a part of what has made the city notable and attractive to the influx of new citizens. All of the technology I need is existing, most likely, and can be reused, though it is a matter of finding the best and easiest-to-use software.