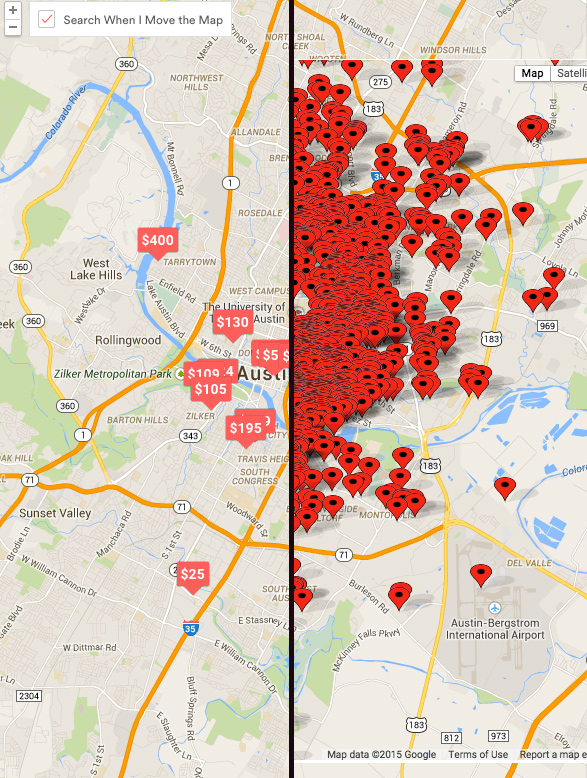
I really like the idea of exploring the data that Trei and Skip talked about last week in terms of Airbnb and how much money is being driven into Austin during festivals. Although Airbnb has ignored my requests for data, I have found two potential data sources. Airbnb does not have an API, but there is a knock-off API that has listing information from 2.5 million entries. The other source of information is AirDnA which gives city-by-city data breakdowns for Airbnb listings by month.
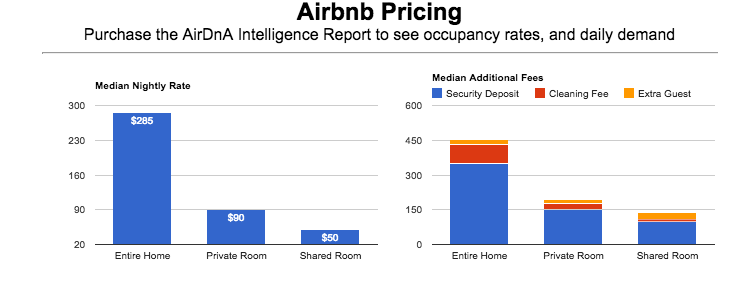
The above graph indicates the median for Airbnb in Austin for the month of February. Obviously, I would expect the March numbers to be markedly increased because of SXSW.
What story are you interested in telling?
I’m interested in telling how much music festivals increase the temporary rental prices/income in Austin.
What topic do you want to investigate?
I would like to investigate how much property owners increase their rental fees during music festivals in Austin and how much of a profit is being made by individuals capitalizing on these festivals are making by increasing their rental fees.
Do you have an interesting lead to follow?
I have the anecdotal evidence of people that talk about how much they can rent their properties out for during events like SXSW and ACL. I am still looking for the data that tells exactly how much these property rates increase.
What would be the best way to tell that story?
Who are your users?
Austinites and people visiting Austin for festivals.
Where are your users?
Mainly Austin, but also across the globe for people coming to SXSW and ACL.
What questions might they have?
How much do the rates increase during festivals?
How much money can someone make renting a property out?
What quality are the rental properties?
Which questions do you think are the most important?
I think the rate increases and profits are the most important questions.
How would you know if this story was successful?
It would be successful if people used the app.
How are you going to measure that?
Traffic to the site and time spent there.
What do you need to tell the story in that way?
I need the data for the months during festivals and the data for non-festival months.
What type of tools or technology will help you tell that story?
I think a map of Austin with a slider bar would be a strong visual component. Showing normal prices when the user slides left, versus SXSW prices when the user slides right for property.