At the beginning I skimmed through the Delivering Data chapter to find ideas about what kind of data can be manipulated for music in Austin. Next I looked through many of the different databases that our wonderful professor gave us. Then I thought and thought, after a while I found mix beverage tax revenue from every place that has a TABC license. I remember we talked a lot last week about this list and decided to use it.
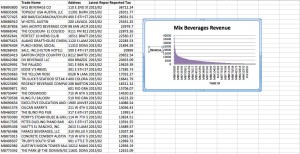
This data shows the amount of mix beverage tax revenue from January to the end of February of this year in Austin. The graph shows the Names of the locations in order from largest tax revenue to smallest. I think this is a good jumping off point to see places that have people play at their location. Not all of these places are bars and will need to be weeded out. There is data from past periods, but the lists are not the same.
I liked how in the Using Visualization to Tell Stories section of the reading there was a paragraph about the two types of readers. The data has to be easy to understand at a glance and be complex enough for a hard read. This a simple rule to remember.