I particularly enjoyed this last chapter of our Data Journalism Handbook because it gave first-hand insight into data journalism projects and finding data sets. It made me feel a lot better that the struggled with finding data sets as much as I have.
Something I found interesting about this chapter was what the ProPublica contributor said about data journalism really being the same as traditional journalism. Data journalism still tells a story, only in a more clear and understandable way. The numbers mean just as much as the words in a news article if used properly.
I also liked the tip that was given numerous times about making your data readily available for your readers. Very few of them may actually use but the ones who do could come up with something you may have never thought of. Its a continuation of the open information atmosphere of the data journalism and coding world.
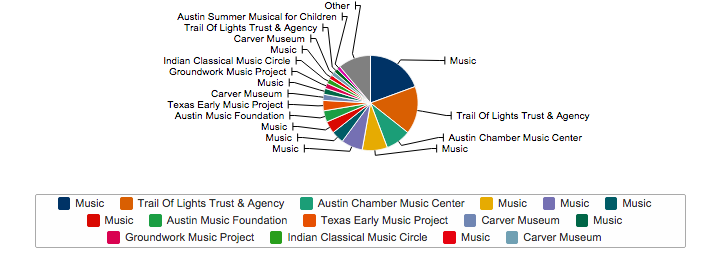
As far as datasets go, I found the Program Operating Budget on the City of Austin’s data site. I was able to hone in on the music and arts industry in Austin and see specifically where money is being allocated. The site also allows you to play with the data visually so I could get a quick look at where money is going.
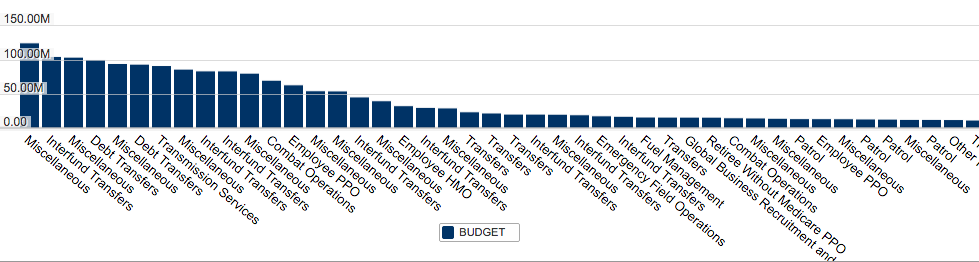
The data is very well organized and we could study how important music really is to Austin by looking where there money actually goes.
I would love to cover the economic impact that SXSW or ACL has on the city and am still in the process of finding data to match that. Our speaker last class mentioned something about being able to see tax receipts for venues and I think that could be very helpful if I could get my hands on them.