As we have discussed countless times, data visualization is so important when telling a story. Whether we display information in charts or graphs, being able to condense information to be analyzed and consumed by the public is now a necessary component of journalism. Of the readings that I found to be the most interesting in The Data Journalism Handbook was the section on engaging people around data. Using data provided by Texas State Controller of Pubic Accounts and Mixed Beverage Gross Receipts Tax Receipts, it’s possible to engage an audience with this data by combing both of them, showing an audience how information in each is related to the other.
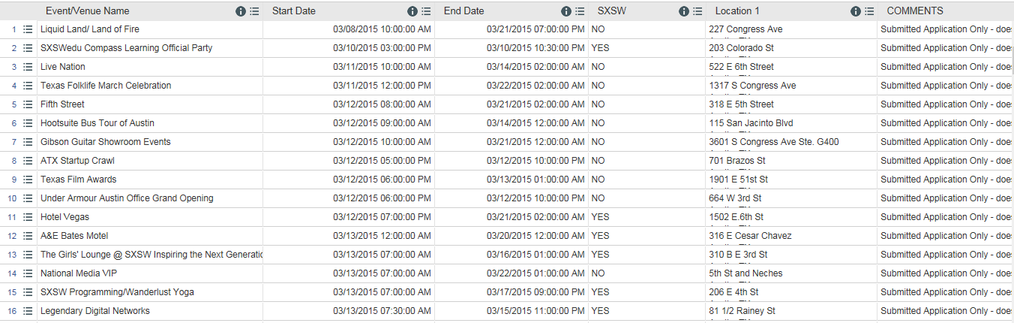
List of all applications received for temporary events during the 2015 Spring Festival Season (March 9 – 22, 2015). This list only includes applications and details known at time of submission. It does not reflect if any adjustments or if application has been approved, denied, or withdrawn.
Mixed Beverage Gross Receipts Tax Receipts
A dataset that shows a list of businesses’’ mixed drink revenue for the month of March. The Texas State Controller of Pubic Accounts lists other months/years of mixed-drink revenue for businesses.
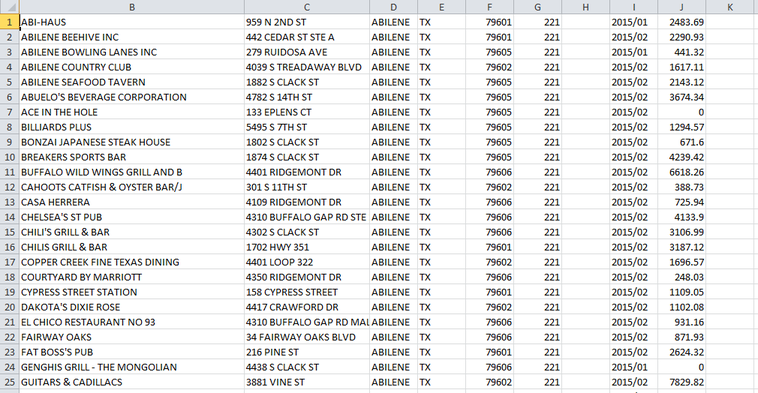
As we discussed previously in class, making use of Mixed Beverage Gross Receipts Tax Receipts sets could be valuable to see which locations people are going to drink. Though time consuming and difficult, if we were to cross this data set with others, such as the Permit Applications, which lists locations that are holding temporary SXSW festival events, we would be able to see which places of business had increased levels of business. If a restaurant or bar had increased business (mixed drink sales) during a time where they had a permit for a temporary event, we would be able to separate it from other businesses that did not have a permit. I’m sure by looking at all the data sets that we have collected as a class, we could combine our separate efforts to formulate a graph/table/spreadsheet that is very informative and complete.
I will continue to update as I find more relevant information.