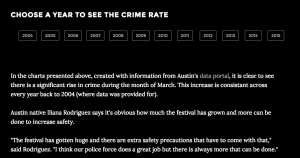
For my final project I decided to follow the question “Does the growth of SXSW positively correlate with an increase in crime rates during the month of March?” I first began by collecting crime data from the Austin, TX data portal and reaching out to SXSW to get their annual growth data.
The layout of my app is done in bootstrap and features interactive buttons to assist the user in scrolling through the page. There are also links available for users to download the data or contact the author.
Some issues that I encountered included both data and bootstrap problems. About a week before the projects was due I realized that all of the crime data I had collected from the city was bad and couldn’t be used (rookie mistake that I should have checked from the start). But, thanks to the Austin data portal and the wonderful Ted Lehr from Texas State’s computer science department, I was able to get my hands on the right data and create all of the crime charts provided on the app. I also had issues stay in in contact with SXSW and was only able to get participant data back to 2009.
I had not used bootstrap in about a year so it took some time for me to relearn it but I picked it up fairly quickly and was able to do some really interactive elements with it.
Overall I really enjoyed working on this project and I am very proud of it. I feel like it is a very interesting story presented in a user-friendly and interactive way. I learned to check my data first and foremost, to be patient and just google it, and that I can handle a project of this caliber which is pretty empowering.

