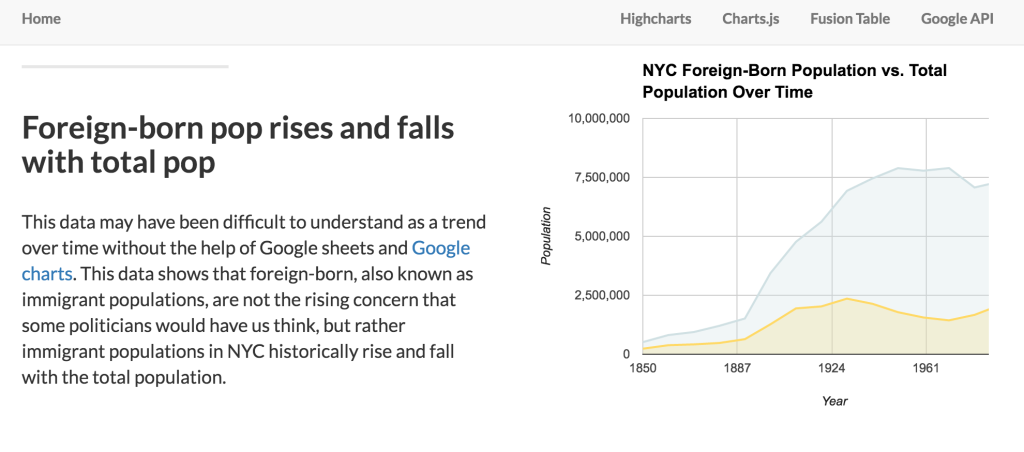
For the charting exercise I decided to take five different data sets that have something to do with New York City and make an interesting graphic/ chart representation of each. This project uses Charts.js, Highcharts, Google Charts and Fusion Tables.
Designing this site was more of a challenge than any web project that I’ve done before since each chart service has it’s own intricacies and tricks. It was fun to take a look at a variety of NYC data and get creative with all of the things I can do with it. I particularly liked using the Fusion Tables once I got the hang of it, and the visualization above is particularly well suited for the data it represents – both a change over time and a part of a larger picture. Check out the full project here.