What story are you interested in telling?
If there’s one thing I’ve realized in my excursions to Austin, TX, it’s that people love to drink. Taking data from Texas State Controller of Pubic Accounts and Mixed Beverage Gross Receipts Tax Receipts, I want to tell the tale of how business with event permits during SXSW increase their revenue through alcoholic/mixed drink sales. I expect to find that businesses with permits will have increased mixed drink sales compared with businesses that did not have permits.
What topic do you want to investigate?
I want to see just how much businesses profit by hosting SXSW events, specifically though their mixed drink sales.
Do you have an interesting lead to follow?
As I stated before, I have concrete data from Texas State Controller of Pubic Accountsand Mixed Beverage Gross Receipts Tax Receipts . Take a look!
What would be the best way to tell that story?
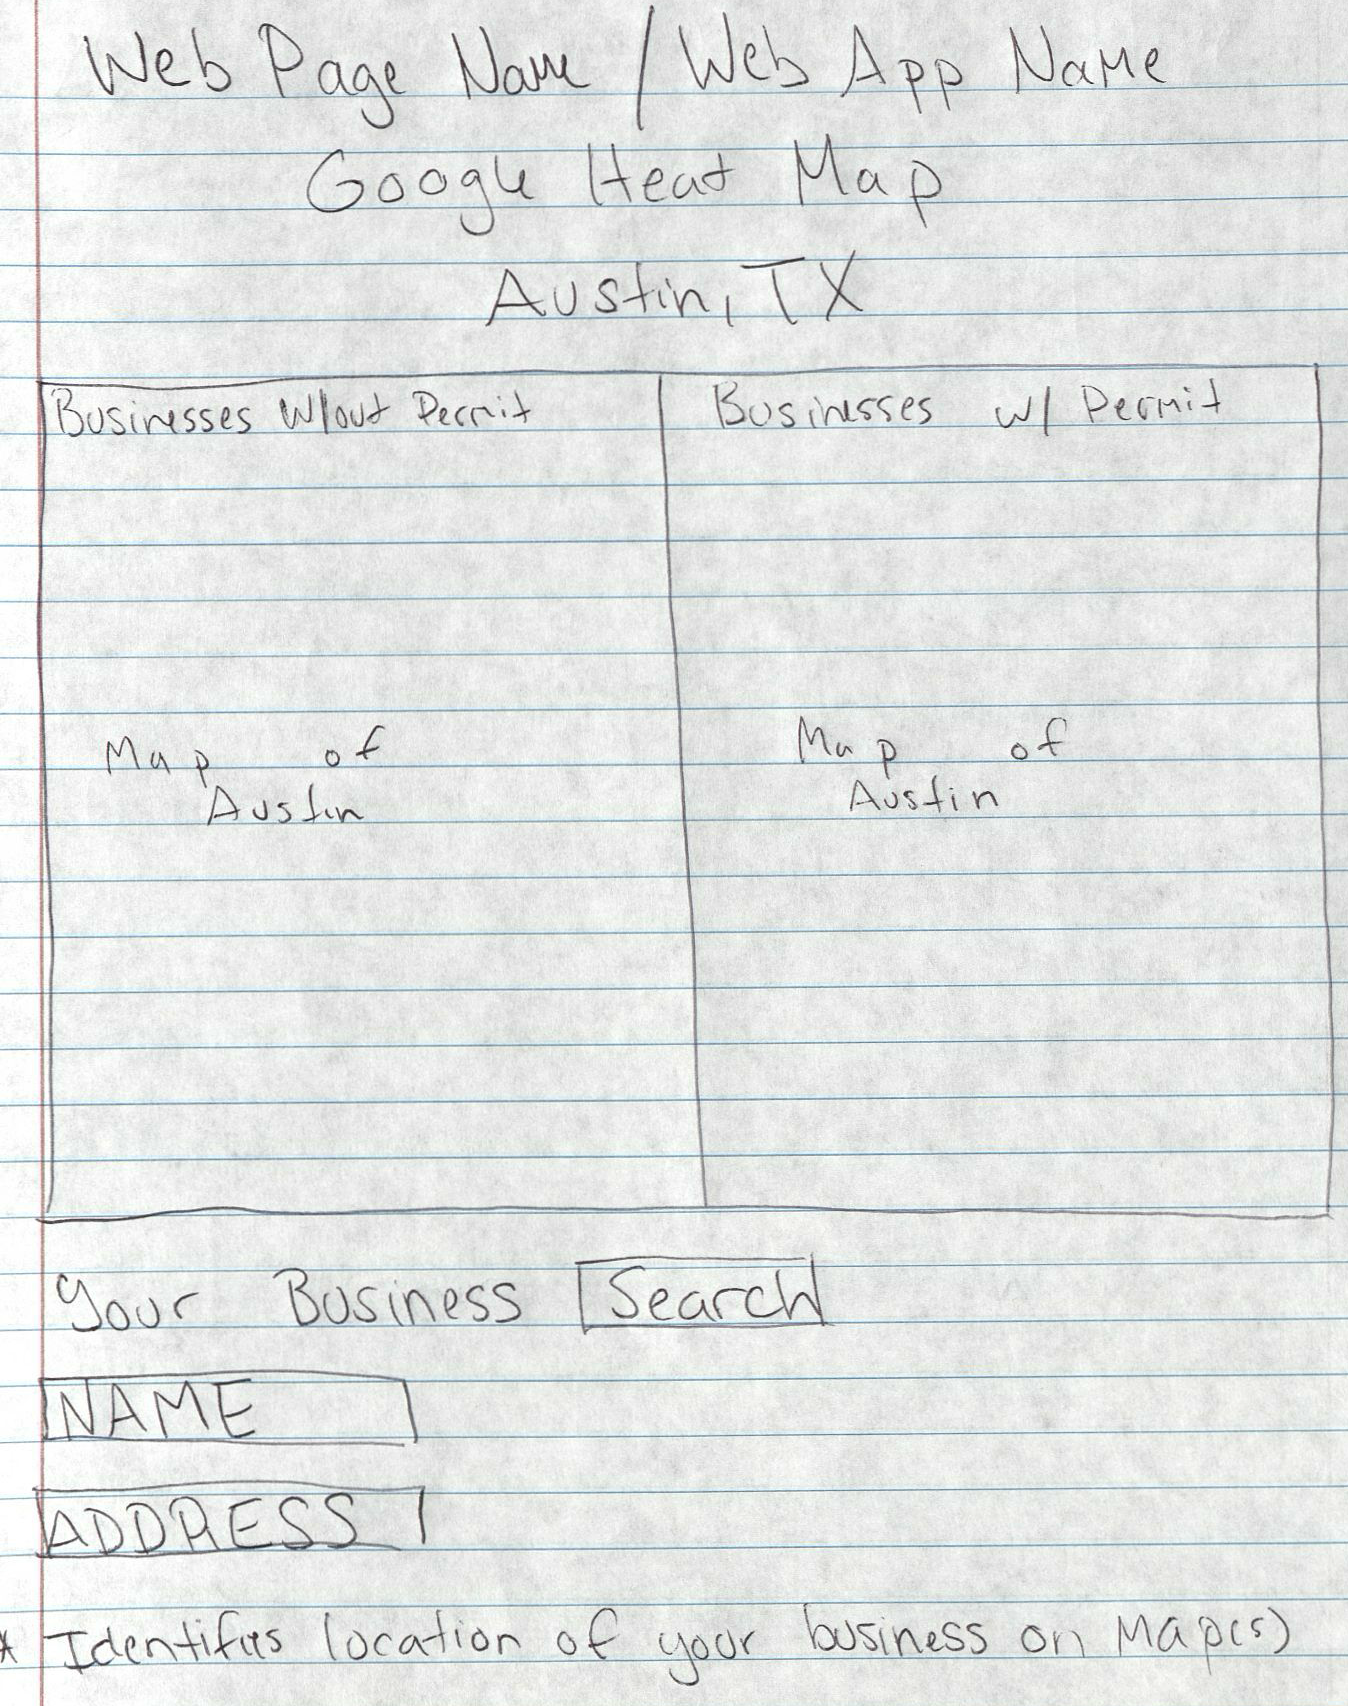
Probably the best way to tell the story is to have an interactive map that pinpoints Austin businesses that are hosting SXSW events. I would make use of a Google heat map, one that shows the greatest density of Austin businesses that are hosting events and are receiving a high profit through mixed drink sales.
Who are your users?
Residents of Austin, but mainly people wishing to attend SXSW. Business owners would find the data extremely valuable
Where are they?
Those living in Austin and the surrounding Texas area. Also visitors to the festival.
What questions might they have?
Where are the businesses (restaurants/bars) that are hosting events and liquor? How much are businesses with permits typically earning in mixed drink sales when compared businesses that don’t have permits?
Which do you think are most important?
It’s most important to know if businesses with event permits are actually showing an increase in mixed drink sales during SXSW.
How would you know if the story was successful?
If people are visiting the map on the webpage would be an easy measurement of success.
How are you going to measure that?
I think a good way to measure it would by how many people viewed the Google heat map on the web page. Monitoring page views is the best way.
What do you need to tell the story that way?
I have the data from the Texas State Controller of Pubic Accounts and Mixed Beverage Gross Receipts Tax Receipts. Using both, I’ll be able to find the businesses that had permits and those that didn’t. I’ll also be able to compare their mixed drink sales, thus seeing if businesses with permits were more successful than those that did not have permits.
What type of technology or tools will help you tell the story that way?
I would use Excel to record the data and a heat map to visualize that data.
Is it really worth that level of effort?
Sure, trying to see whether a business with a permit can make more of profit than a business that doesn’t have an event permit can be used by local Austin restaurants and bars. It could convince them to pursue an event permit.