A story without facts is difficult to believe and facts without a story is difficult to relate. Combining both to both teach and give you insight is rather a beautiful thing. Data journalism has given us a tool that allows us to see the big picture with appeals to both the logical and sentimental side of humans. Of the examples given in class I was most interested in was Where Does My Money Go and The Opportunity Gap.
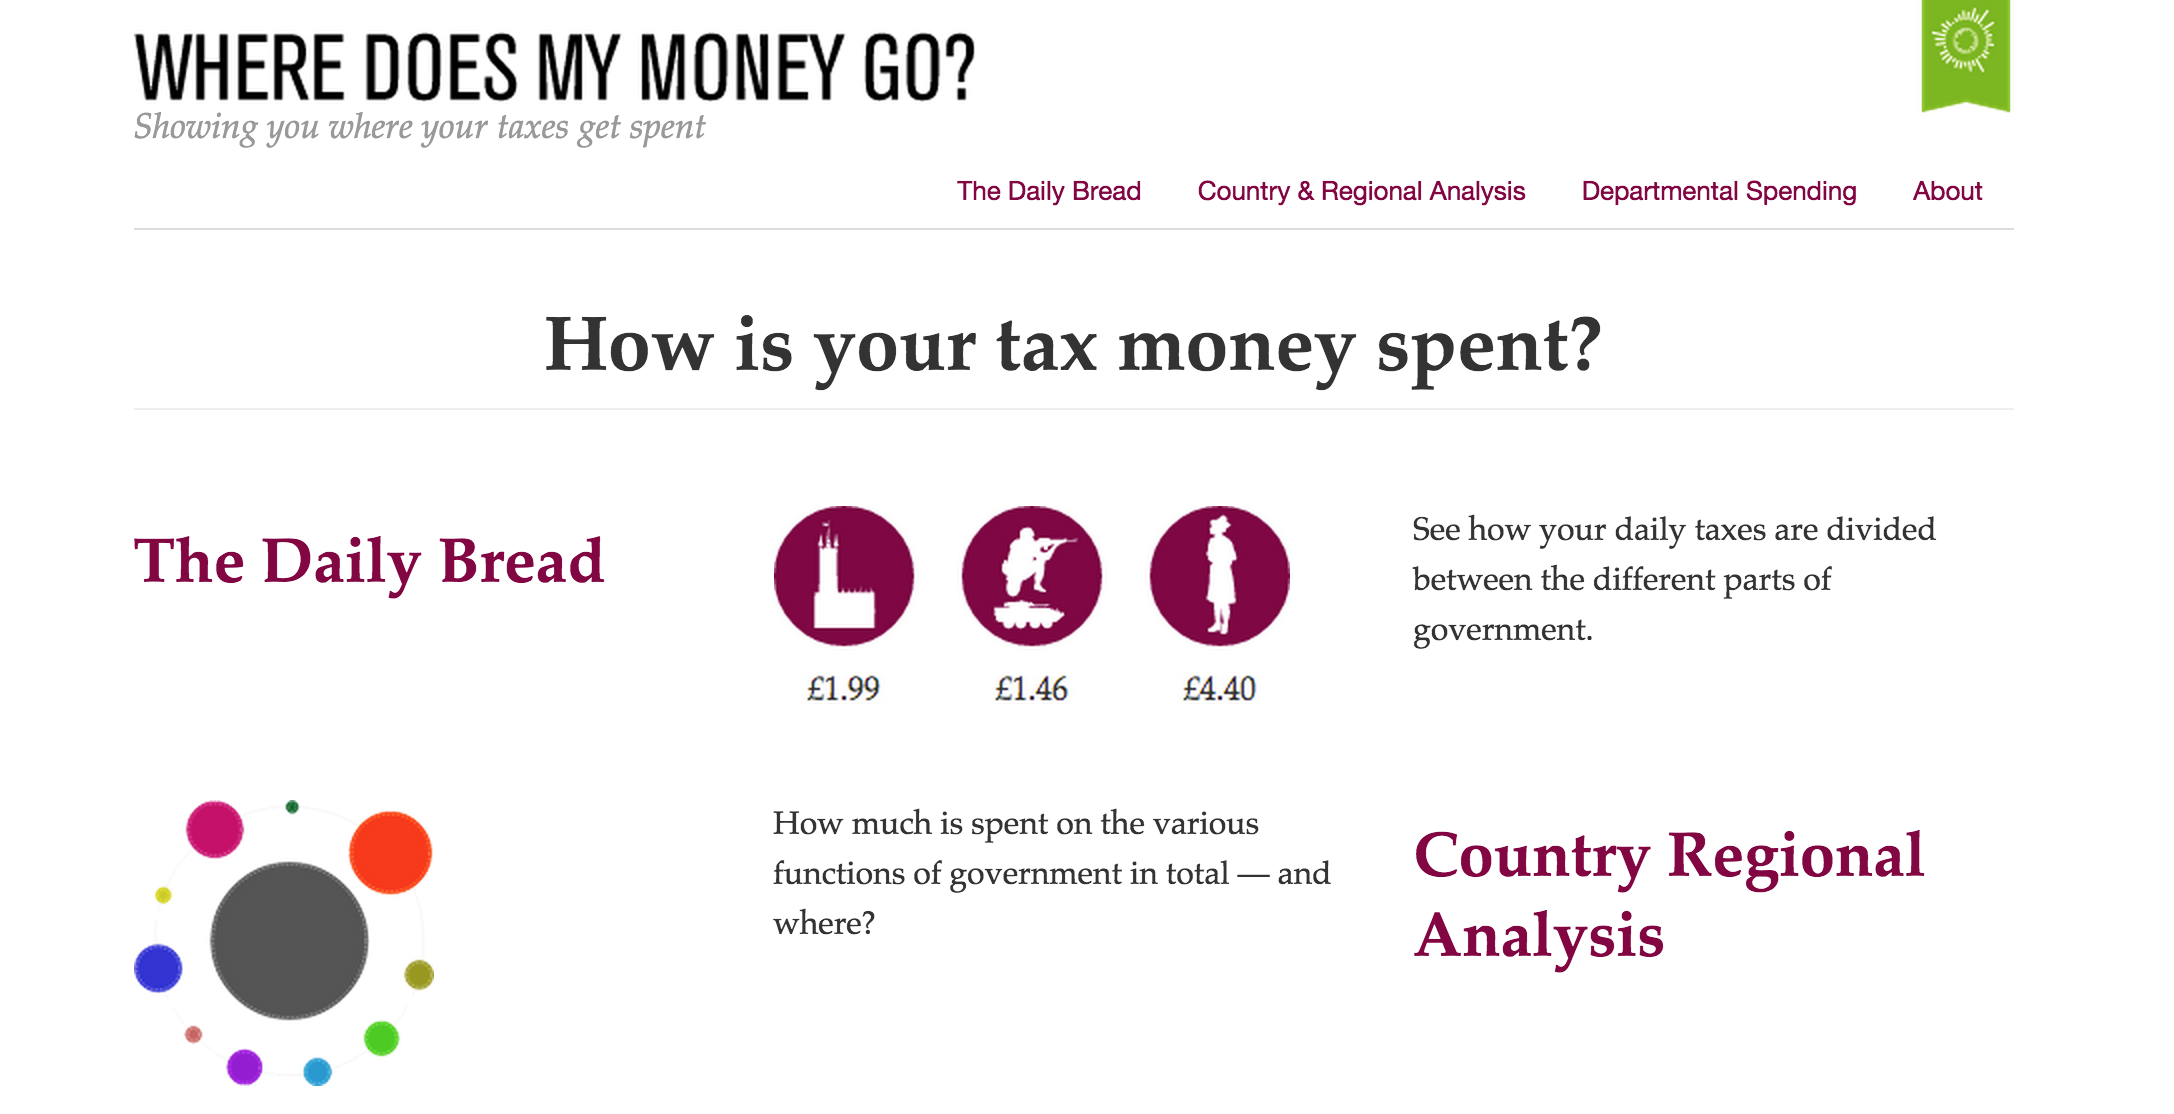
Following a devastating blow to the economy, the world found itself in 2008 scrambling for answers. Hadn’t good government shielded us from despair? Where did My Money Go was an incredible resource that allowed citizens to see where there tax payer money went and exactly how it was being spent. I found it illuminating since the money given to the government is never really tracked and having a powerful tool such as this one could give the people the power. Using analytics such as this one would not leave citizens ignorant and would use it for change.
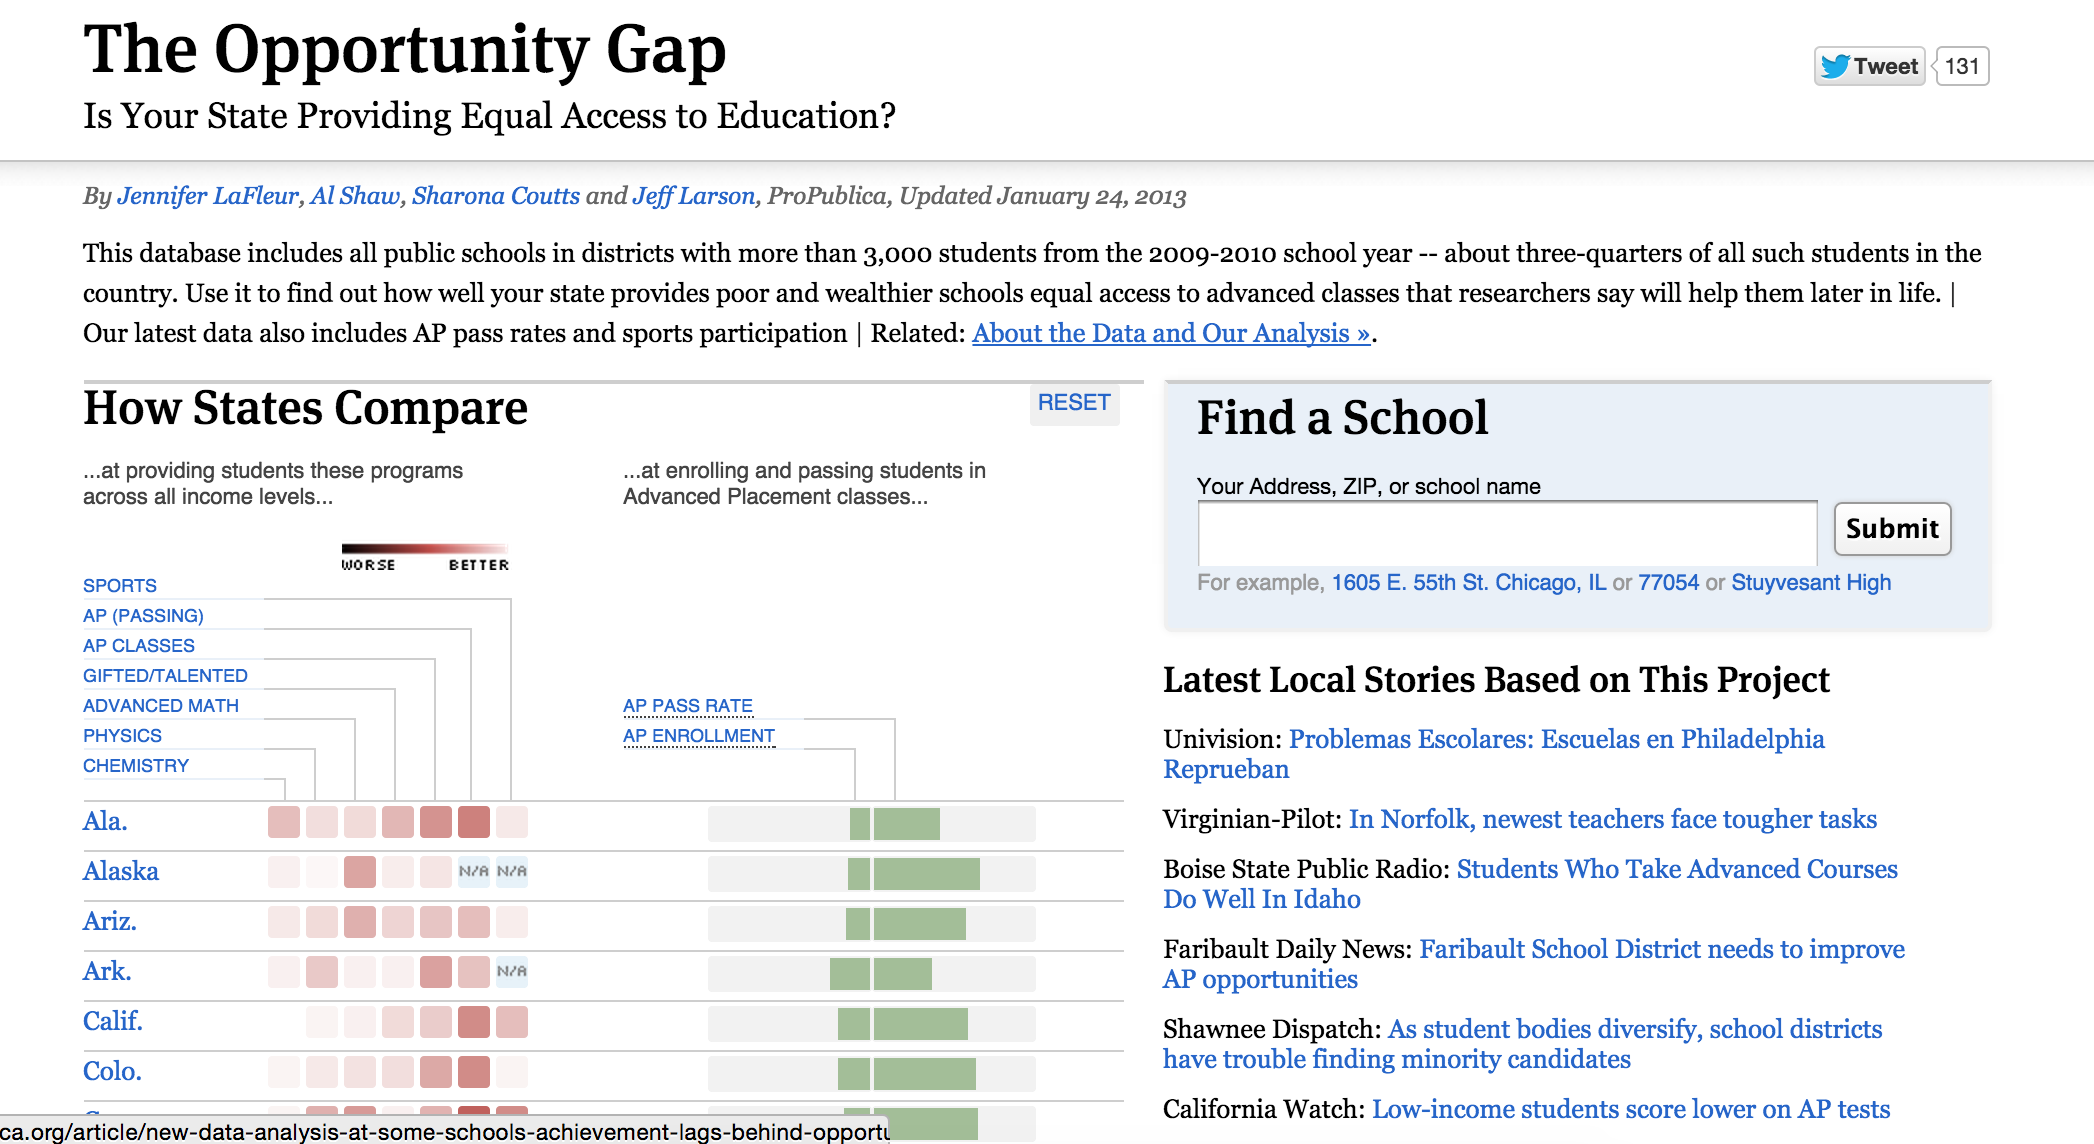 Education is placed fairly low in the United States. Knowing that certain state place higher emphasis on education is very important. The Opportunity Gap gives great insight into the levels of education of schools in your area. I found this tool very important for it helps not only its citizens place their children in proper schools or it allows others to advocate for change.
 My personal favorite data analytics website is NPR’s Borderland. It was a multimedia project conducted over a series of months that highlighted life in the borderland. Being from Cuidad Juarez nothing could have drawn me more to the storyline. Using averages in analytics, the website tracks the amount of activity happening in the borderland in realtime while scrolling though the many components of the story. The story not only gave analytics but published videos, audio recording, photographs and immigration analytics. When the slides are done you are given the astronomical activity that has happened in the borderland while the user has read the story.
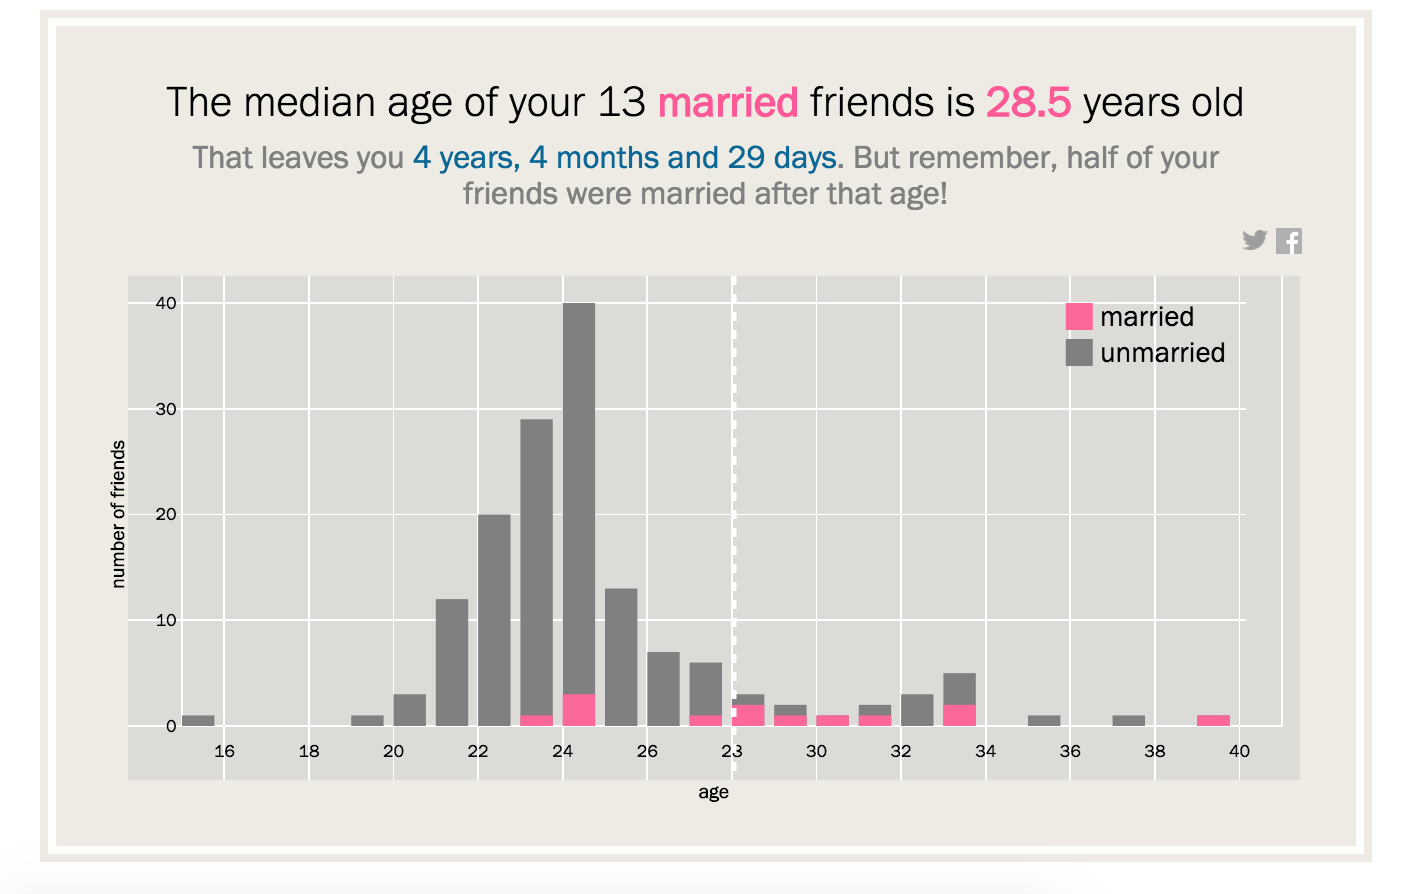 My other favorite data website is Times Marriage Predictor. Based on your own Facebook friends, Time analyzes through a bot what is the mean median and mode of marriages and estimates the time you will get married. It is fun and insightful and can freak you out for the rest of the day.