 Hi! My name is Maria and this is my second semester in grad school. I graduated from UTSA a little bit over a year ago and decided to dive right into pursuing a masters. Last semester I took the media design class and felt at home. Although it was challenging at times I had fun and think that I found my niche, so here I am trying to learn as much as I can before I graduate with my second degree.
Besides school, I work in the retail industry as of now. The flexible hours really work with my abundance of school work. I work at Gap at La Cantera in San Antonio. I can’t hand out discounts or anything but you can always stop by. You can see me featured on their instagram which is pretty much my only 15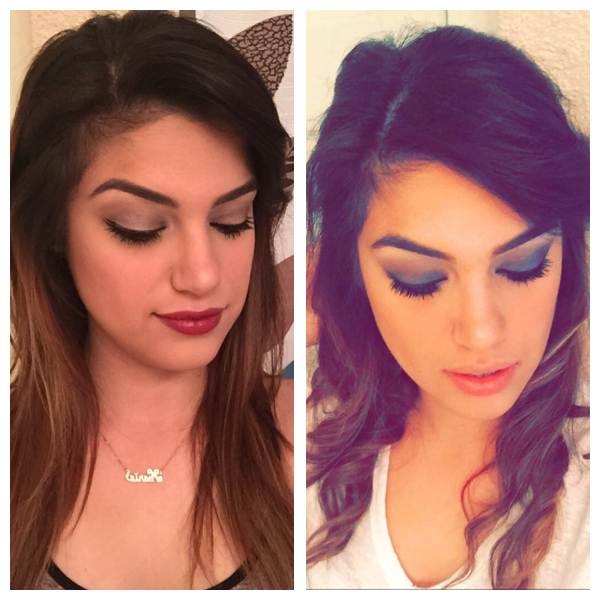 minutes of fame that I have. The one hobby that I have is pretending that I’m a makeup artist and trying things I see on pinterest and instagram. I say “pretending” because I am no professional but I have a lot of fun getting all dressed up to go out, or even if I have enough time before work I’ll try a new look. I haven’t had experience with putting makeup on others and I don’t feel like going to cosmetology school on top of the schooling I have already acquired so for now I’ll just stick to trying things out in my free time.
But enough about me and more about data journalism. When told to write a blog about what we think data journalism is I was a little intimidated because almost everything in this class is going to be new material for me. After reading the Data Journalism Handbook everything become more clear. For me I think data journalism is taking raw data and making it physically/visually appealing so that it is easier to translate to others, whether that be a visual representation, charts, graphs, anything like that. My own example to understand this better would be to make a visual representation of budgets, revenues, deficits, and so on, in a company. I use to be a manager and would have to look at numbers on a page that would say if we were making money, essentially. It hurt my eyes to look at it. It was literally just a spread sheet of numbers that all seemed to run together. If there was a visual representation of the raw data I’m sure I would have understood it better, especially since math is not my thing.
Data Journalism, to me, has a bright future ahead of it, especially with how fast people are getting their information. It is important to grab the reader’s attention and data journalism can do that quickly with its attractive visuals. Once the reader’s attention is grabbed it will be easier to spread the information from one reader to the next. It is also, in my opinion, a better way to represent raw data. I can look at a spreadsheet with numbers on it all day and still not know what it is suppose to mean, but data journalism translates it to a language that I can understand, and still gives me all the information I need.