As a person with a streak or two of paranoia in his personality, I was struck by this example from the handbook. I was also fascinated by how much insight could be gleaned into a person’s life from bits of information that mean virtually nothing in isolation. The cumulative impact of data was made very clear to m, as was the possibility that my life could be very easily figured out by somebody with interest in doing so.
Diving into other examples of data visualizations online was a fun experience. I had come across an instance of data visualization a long time ago that I had been wanting to revisit since our class began. This post took that off the back burner and I hunted it down. The Guardian created a visualization of the legal status of LGBTQ citizens in the United States based on which state they live in, pictured to the right. I love this example for multiple reasons. The design is appealing, and laid out in an easy to understand way. The organization by of the states by region was a smart move because it allows users to get an in-depth look at a particular place and see the trends happening within the larger region. The key in the circle’s center is a nice touch as well. I also love how useful it is for multiple purposes. If an LGBTQ person were considering a move and deciding where to live, this visualization could provide them with an overview of what their quality of life might look like based on where they moved. It is also a nifty way to show users that despite a massive victory in the arena of marriage equality, the fight for full LGBTQ enfranchisement is not over.
A second example, and a new one that I came across in my research, is a lot more frivolous. As somebody who LOVES listening to the song that their most into at the moment over and over again I was thrilled to come across this invention.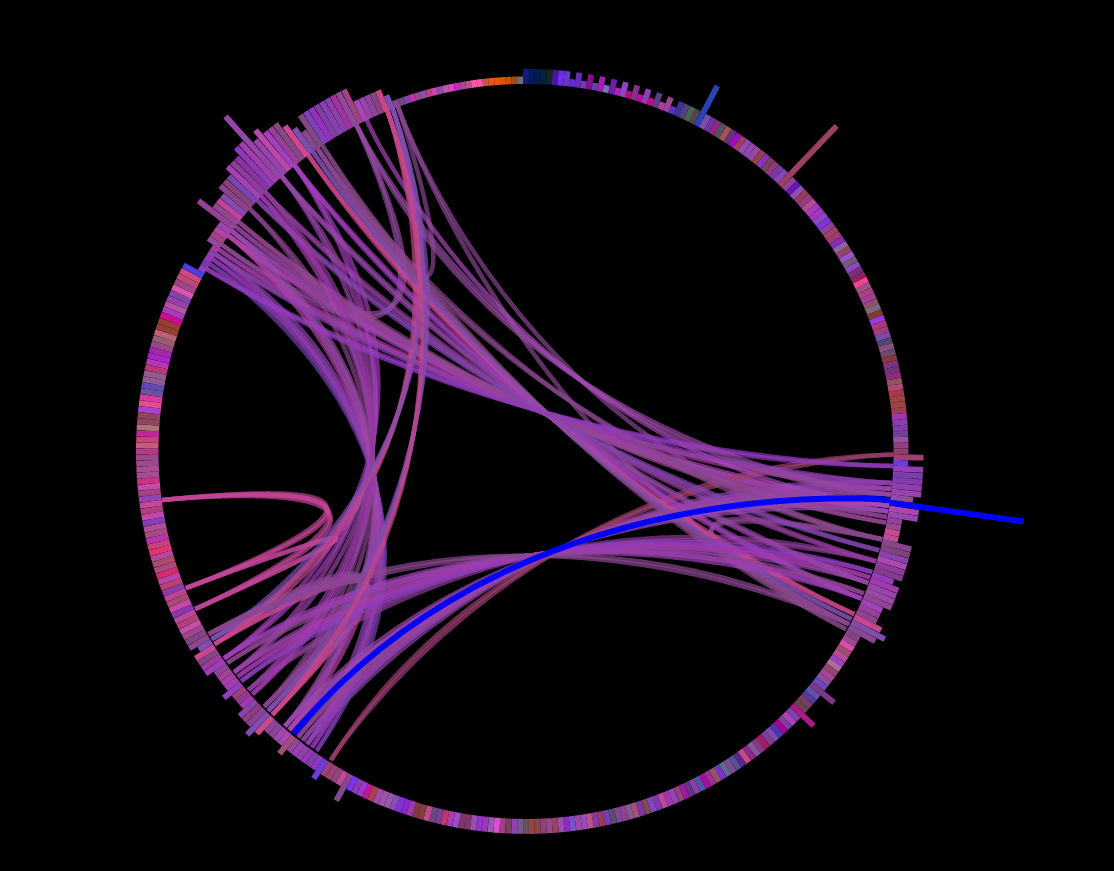 The Infinite Jukebox takes an Mp3 and plays it in an endless loop, but the loop is not sequential and does not start and stop. It instead finds all the similar beats of the song that would lend themselves to being blended with each other and, seemingly at random, jumps around various parts of the songs with compatible beats. This is, of course, a rather simplistic explanation from somebody net versed in music theory. At any rate, what really makes the jukebox cool is that it visualizes the song and shows you where the beats connect. An example is shown to the left. As the song plays the circle also builds outward on the points that get played multiple times. It is interactive as well, and the site provides a key of how to make particular sonic alterations. I’m not a big fan of that portion of it. I prefer to just let it do its thing and watch the cool visualization.