I have always envied people who had legit Spring Break vacations. I have spent the last 5 spring breaks working at a theme park. This year was different because I was actually running my entire department and also had a visit from the district manager, talk about nerve racking. After 70+ hours of working in one week alone I wanted to know if it was worth it and what impact I actually made for the company. I’m also a new, young manager, so I need to know if I am keeping up with everyone else.
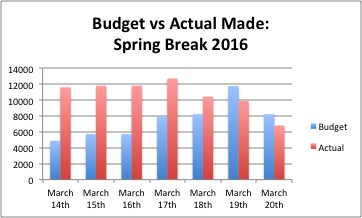
So this is the chart I made from data of what was budgeted (usually from the previous year) and also data from what my team and I made throughout spring break. For more simplicity everything was rounded to the nearest dollar instead of having cents lying around. This was as simple as the hot dog eating contest example. Simply plug in the numbers into Excel, highlight, and create a bar graph. The Y axis states the revenue in dollars, the X axis shows the days that were documented. The blue bar is what was budgeted for that day and the red bar is what was actually made for that day.
If I am looking at this chart from a completely BIAS standpoint I would say whoever is running that site is a badass! But let me be unbiased for the sake of argument. It is shown that up until March 19th budget was exceeded by quite a bit and that on March 19th and 20th the budget was not met but still not as big as a gap as the other days.
This raises the question “Why was the budget exceeded for all but two days?” The answer is really simple. On March 19th San Antonio experienced strong winds the entire day and key major money making rides were closed due to this. If the ride is not running photos cannot be taken of people on the ride and the people can not purchase said photos. So we only had two major rides open making all the money for us that day. We could coordinate the wind speed, or weather, with this graph to show that depending on the weather also depends on the revenue made.
On March 20th the projected attendance was much lower than the actual attendance. For example, If 2,000 people are projected to show up to the theme park but only 500 people show, is it reasonable to think the budget will be met? If you said yes you sound like my boss. It isn’t reasonable because the budget was set accordinging to the attendance. March 20ths attendance was lower than projected so the budget would have been very difficult to meet that day. We could also coordinate a graph with park attendance and projected attendance to show how this correlates together.
In summary the graph shows that for this specific week in time budget was exceeded for most of the week and shows you by how much. To answer the questions of why two of the days the budget wasn’t exceeded separate graphs would have to show the correlation between attendance and weather that factor into revenue.