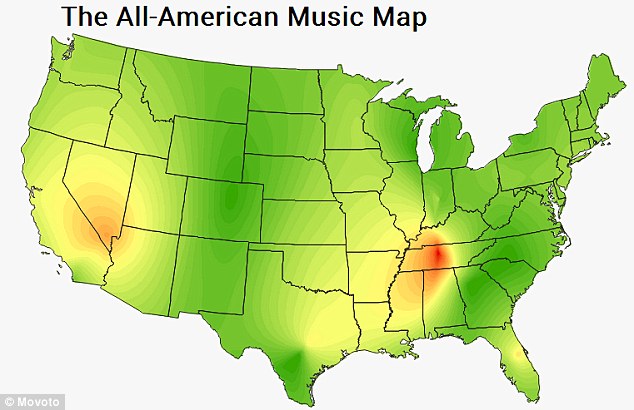
For my final project I want focus on the economic, social impact different genres of music bring to Texas, primarily Austin.
For example it would be interesting to focus on how Rock-n-Roll has shaped Austin culture and if this specific genre of music brings in a different revenue than Rap or Hip Hop.
How do certain genres of music shape parts of the city, and what sub-genres come out of these genres.
It would be interesting to focus on a few popular genres such as, Country, Folk, Rock-n-Roll, Hip Hop and Rap.
Maybe these kinds of music have changed the culture in a specific way and has opened doors to different kinds of economic and social benefits.
This is something I tried to explore with when I created by pie graph in Google Maps. I wanted to find a study, which evaluated the most popular genres in Austin, but could also explain the economic and social impact of this kind of music in the city.
Unfortunately, I could only find the most popular genres- based off of Myspace searches – but I could possibly take the top three most popular kinds of music and figure out it has changed Austin economically and socially.
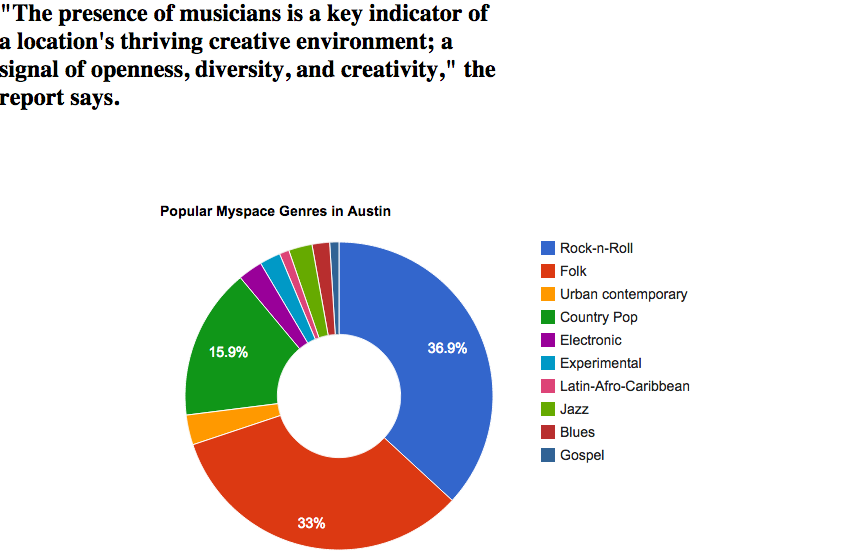
Of all the three different kinds of maps played with, I enjoyed using Google Chart’s pie graph. I thought this would be the easiest kind map for readers to understand exactly what kind of information I was trying to explain. Even though, some of the other maps were more aesthetically pleasing, I thought Google Charts pie chart was the easiest to read. Here is a link to my chart.