My final project took a turn when I needed to do some research on my own for my job. I recently was promoted to a full time position as a manager and was not given a lot of training on how to execute this role. I would complain to my boyfriend about it a lot and he has a different attitude on life than I do so he told me maybe I should do something about it instead of talking about it. When I started researching about first time managers or young managers I found out I was not alone. This is where the idea of my project came about.
I actually enjoyed working on this not only because it helped me out personally with my job but I think that it can explain how things work to those who are confused about management positions, need to find out more information, or need a place to start their own training. I tried thinking how I would want things explained to me, and through data since that was apart of the project, and then thought how I would teach it to someone. It made me really think from both perspectives as a student who wants to learn and as someone who is suppose to do the teaching.
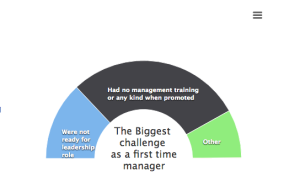
My favorite page is “The Basics” page because I added features where charts and graphs will not pop up unless scrolled passed. I thought this would help a student to be able to go one step at a time, and not move on until full understood. I also wanted to create activities such as fill in the pie chart so that the “student” would see if they were on the right track of knowing how budgeting works.
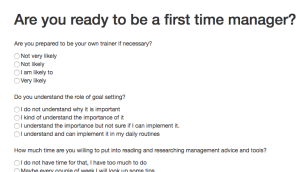
 At the end there is a quiz to direct people on the path that is best for them. Some may need further studying on manager positions and others may only need to brush up on a few skills, but the quiz points them in a direction that will help them do and be their best.
I enjoyed working with the data of this project, I enjoyed making charts and graphs that people will be able to understand from a visual standpoint, and I enjoyed adding unique features to my site that would help with a learning experience. I hope you enjoy it as much as I do.