 With the NICAR conference still fresh on my mind (albeit, the conference turned my brain to mush, so maybe not the best time to rely on it), it feels like it would be a criminal act to not use some of the toys I learned about at NICAR.
First and foremost, I want to use Twine which allows developers to create a sort of choose-your-own-adventure news story. If users used this to select what they were interested in, music style, venues, neighborhoods, the app would be able to direct them to an appropriate venue.
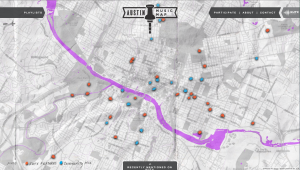
Using an interactive similar to the Austin Music Map, the content would have to scrape from a source that had band listings. If an updated list wasn’t available, then aggregating the data of what style of music plays where, would at least be able to give an educated guess on where the best chances are for the music the user is looking for.
Those are my thoughts on how to do some data visualization with an interactive element after this weekend. Absolutely willing to workshop this idea with someone to develop it better.