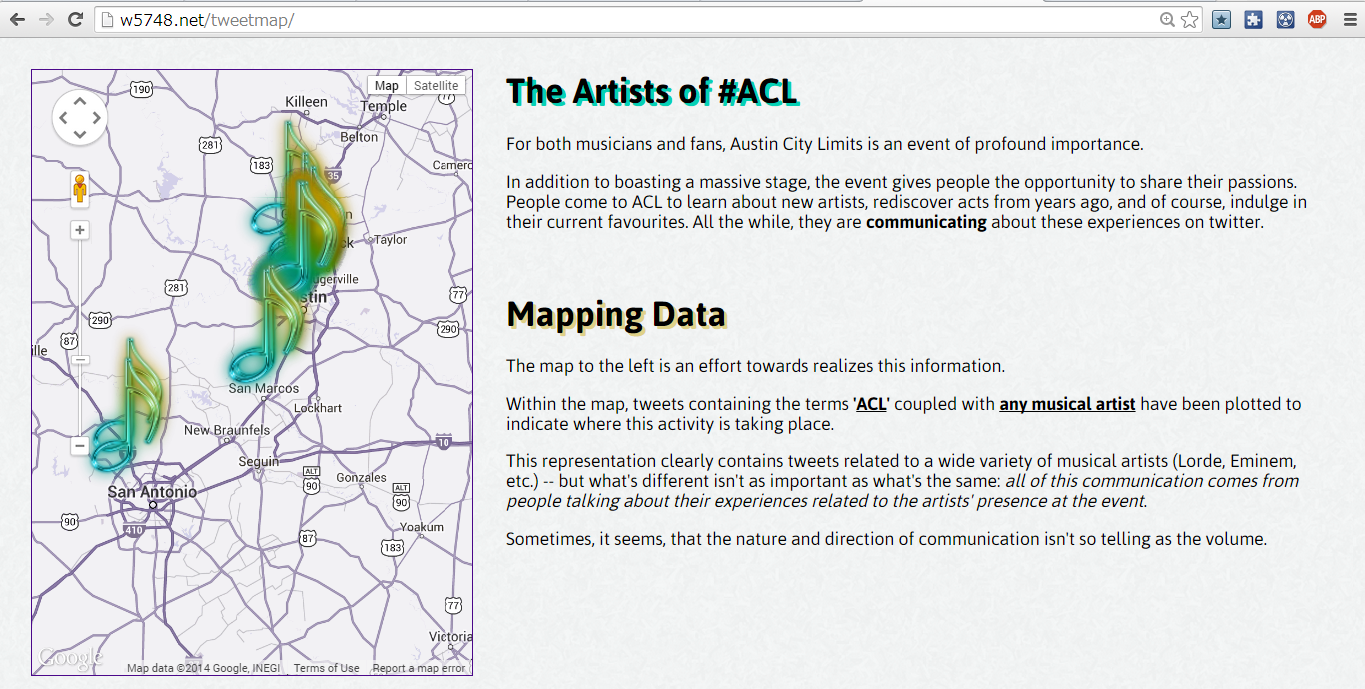
The above was an exercise in pulling down Tweets with Python and mapping that information with the Google Maps API. The process involved coding, troubleshooting, and of course, visualizing data on the web.
Of all the things I learned from this assignment [quite a few] the most striking to me was the simplicity of editing the display of the Google Maps API. In an effort to customize the output, I searched and came upon a website called “SNAZZY MAPS“, an open-source collection of overlays for Google Maps.
They are incredibly easy to install, look fantastic, and can help create a memorable experience for the user beyond the ubiquitous vanilla Google Map.
On another note, I’ve started trying to use GitHub.
One thing I find encouraging is the “ACTIVE STREAK” counter, denoting the number of recurring days you’ve added or changed content. Even though I’m only on Day #5 … I still find it motivating me enough to sign-in and upload more work. Here’s to hoping I can stick with it!


