Okay, I bet everyone was thinking my final project was going to be on animals. It still possibly could be.. But I’m going to live on the edge and try something different. Remember the ‘Is It Better to Rent or Buy?’ data visualization project from The New York Times? I love this concept. But what I also have started to love is planning ski trips that I can’t afford or figure out which fits best for what I’m looking for.
Like the Rent or Buy visualization, you were able to tailor it to the person using it so it developed a unique result. I would specifically narrow down the topic to Colorado and would like to have things such as: How much do you plan to spend? What kind of terrain suits you (beginner, intermediate, expert)? Are you looking for a specific run time down the slope (if so you could choose). And a few other questions. While they are choosing there answers it would be creating a unique answer on the right hand side for what sounds like a best option for them. Once it gets narrowed down to a certain amount of resorts, I would like to throw in a bunch of other data about the resorts like: reviews, how many lifts there are, etc.
I will more than likely be scraping data from several websites, one I found of use for this project is www.onthesnow.com.
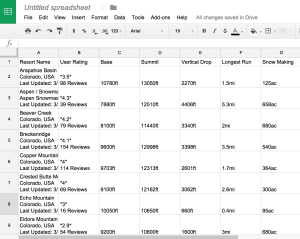
UPDATE: I just used the importhtml in Google Spreadsheet and got results! It was awesome!

