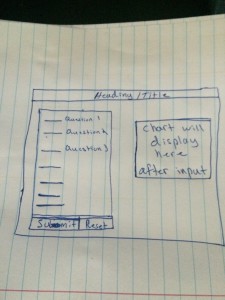
For my web app project I want to do some sort of quiz. I’m not sure exactly what the contents of the quiz will be, but I will make use of the formail.php that we worked with earlier this month. I’ll display some questions on a page that the user will answer and then submit.
Depending on the nature of the quiz, their results might be displayed in a chart, to represent how their info compares to other data, or it could just be a redirect that gives them information about what their results mean. However the results are displayed, I want to make them interactive, using javascript and the interactive charting.
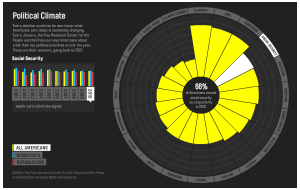
If I could display the results in a cool pie chart like this I’d be excited.
UPDATE:
I’ve decided to scrap my original idea. Instead, I’m going to do a budget calculator type app. The user will type in how much they spend on a number of categories and when they submit it will break down their yearly spending. I want to display this information in a chart.
Link to my webapp: here

