Hello coding compatriots! (^-^)v
It was nice meeting all of you in class last week! Again, this is Jesse – your resident hipster/nerd. I’ve supplied a photograph below for a mental bookmark.
The remarkably spry looking fellow on the left is indeed my father. This photograph was taken on a recent hiking trip up in Montana. He’s the best.
To recap a little bit about myself: I’m graduating this December with a degree in advertising and a minor in English. Outside of the classroom I’ve had some limited experience with coding and web development but I’m far from an expert.
When I’m not in class or nerding it up, I spend my time studying Japanese and hanging out with friends. My favorite authors include Haruki Murakami and Sam Harris, and my all time favorite band is サカナクション (SAKANACTION). Give them a listen sometime.
Likewise, I’m really excited to be in this class and for the opportunity to work alongside each of you. It’s going to be a great semester- I have no doubt that we’re going to learn a tremendous amount about storytelling in the age of mega data.
In considering ideas for our class project, I’ve made an effort to adhere to our challenge fund outline as detailed on the ONA page. As I see it, the criteria for the project is two-fold: (1) to challenge the status quo of music journalism by utilizing new story forms, and (2) to present material that “reflect[s] the role of music in the community.”
In my eyes, both of those elements make up the heart of the challenge – but there are a number of different angles a potential story could take. Here are some of the subjects I’ve been thinking about.
- Telling a story about how Austin musicians are staying connected with local audiences by comparing ongoing social media use between various groups.
- Telling a story about the anticipation for local artists at upcoming events by visualizing real-time social media buzz on Twitter and Facebook.
- Telling a story about the growth and changes of specific venues within Austin by using attendance data (both bands and fans) to illustrate the volume of increase in a dramatic way.
A more detailed depiction of these concepts follows with examples of similar work.
- HOOK: 1. As the music scene continues to attract talent into Austin, how are local bands staying connected? (Webpage/Mobile App)
- By polling and/or researching local bands, we can determine the primary ways that they’re staying in touch with audiences despite the attention that outside artists.
- This information can then be presented in an interactive way, while simultaneously serving as a directory. Icons/graphs that then have the ability to redirect visitors to the band’s social media.
- Clusters could be an interesting way to visualize this. For example, we could separate social media platforms based on color and then visualize bands as icons / circles, and depending on how large their presence is on that platform, the circle size would scale.
- This form could potentially tell several stories simultaneously – ie: XYZ band is massive Twitter but has virtually no presence on Facebook || Austin artists all have a Facebook page, but don’t use it that often (speculation) || Wow! Myspace has made a complete resurgence! (again, speculation)
- By polling and/or researching local bands, we can determine the primary ways that they’re staying in touch with audiences despite the attention that outside artists.
- HOOK: 2. What bands are the most anticipated for XYZ upcoming event? (Webpage/Mobile App)
- Images of attending bands would scale in size based on how much buzz they’ve received on social media in the weeks leading up to the event.
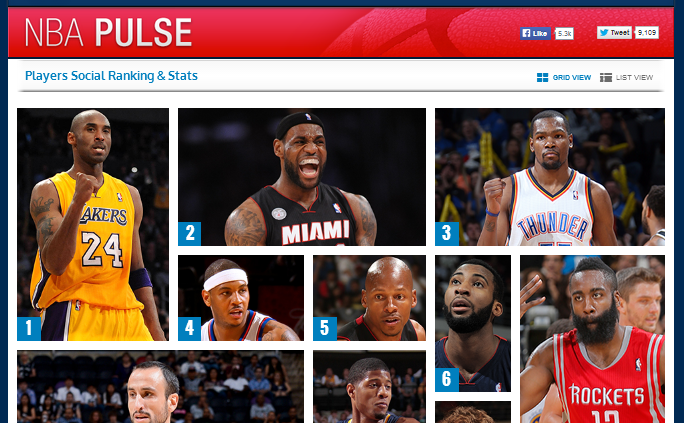
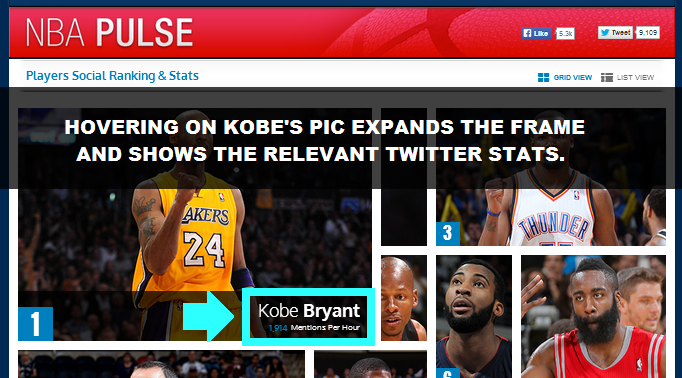
- The NBA uses a system like this to great effect on game nights to show what’s trending on social media in a really neat (visual) way.
- Images of attending bands would scale in size based on how much buzz they’ve received on social media in the weeks leading up to the event.
- The images, when hovered / clicked could display information about the band, their history, links to social media, etc.
- In doing so, fans and enthusiasts of bands are encouraged to share / reblog this type of content. The module is interactive, visually interesting, and offers friendly competition between the groups.
- This information can be sourced either from scraping social media, local news sites, or by simply conducting primary research. Likewise, it might be possible to implement a poll directly on the site.
- HOOK: 3. Year on year, what trends have emerged for local venues in the Austin music scene? (Webpage)
- We could depict changes in the volume of artists, the number of attendees, or even the time-frame of when most shows are taking place.
- This information would likely need to be retrieved by conducting primary research (ie: calling up notable venues and asking for booking information – could potentially be time consuming.)
That’s just a few of my initial ideas. I’m going to be brainstorming throughout the rest of the weekend as well as checking up on this page to steal, er, to get inspiration from everybody else. I’ll likely edit this post before class on Wednesday. Have a great weekend everyone!


