Texas State has seen a huge amount of growth, especially within these last couple years. I decided to look at the enrollment data on the university’s website to analyze the data in regards to ethnicity. The university has always been predominately White, based on university enrollment data, but has grown in enrollment of Hispanic and Black students. In 2010, Texas State became an HSI (Hispanic Serving Institution) meaning 25% of the student population was made up of Hispanic students. Universities that are recognized by the state as HSI’s are given grants to expand educational opportunities for Hispanic students. As shown in the data below, the university seems to be successful in that expanding those opportunities.
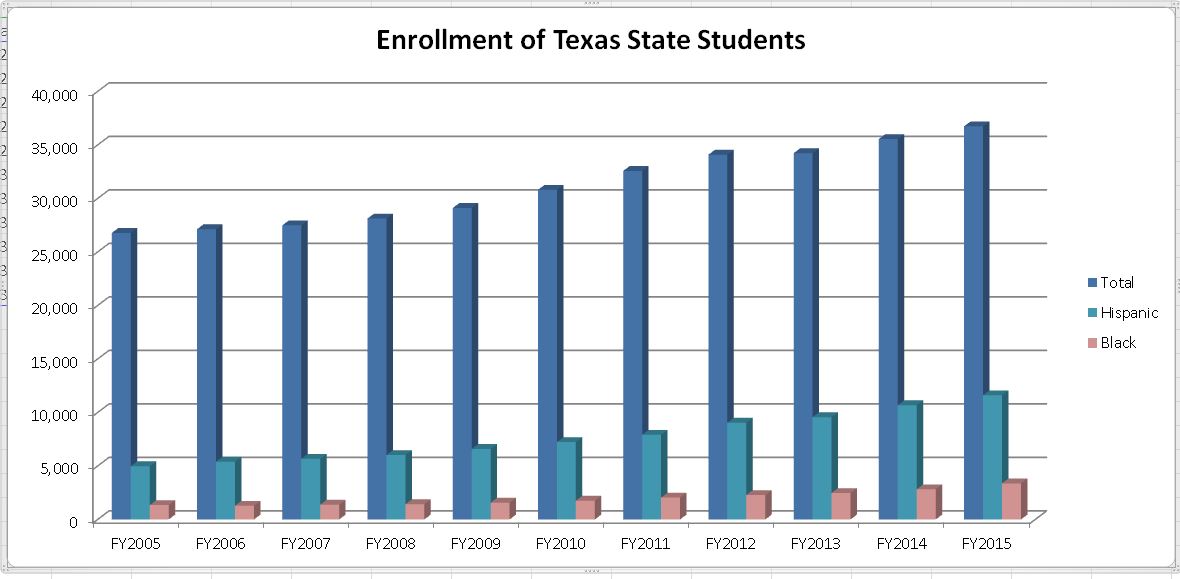
This chart represents number of students enrolled in the Fall semester of each year. The university’s fiscal year runs from September 1-August 31 each year. The letters ‘FY’ seen within the bottom axis stand for ‘fiscal year’.
![txstenrollment]](https://coding.cindyroyal.net/wp-content/uploads/2015/10/txstenrollment-1024x502.jpg)
I chose not to include the enrollment numbers for white students, because there hasn’t been a significant increase or decrease in number of white students, but there has been an increase in both ethnicities shown in the graph above. I also chose to leave out other minority groups from this data set because those numbers weren’t significantly different over the years.
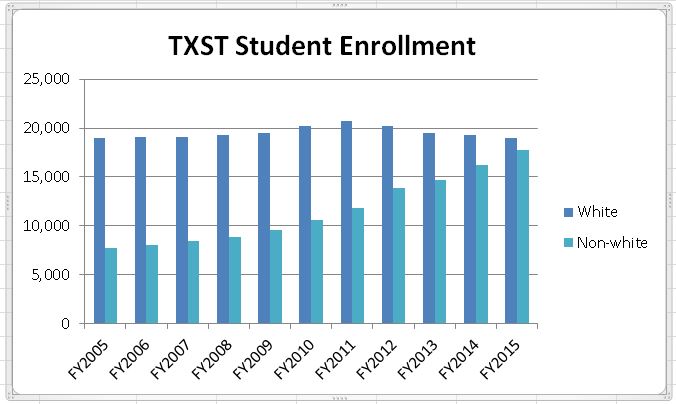
While our university is still predominately white, the total number of minority students is beginning to catch up to the total number of white students, as seen in the chart below.
Pretty cool!