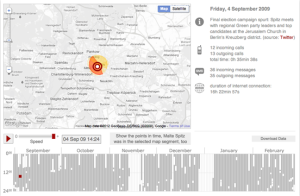
So out of all the case studies, I think my favorite hands down was “The Tell-All Telephone.” In this case, Malte Spitz gathered data from his cell phone. With the data, he was able to create a detailed profile of his daily habits. You could see where he worked, where he lived, when he took the train or a plane, or even when he was awake or asleep!
 What enticed me about this story was that he had to file a lawsuit against his cell phone company. I mean, it’s his data, he should have the rights to do with it what he pleases or at least see it. Another thing is that this data does exist. Just through looking at cellular positions throughout any given time of day, you can create a profile off someone you don’t even know! – Thankfully though, this data isn’t open to the public. That would be minutely terrifying.
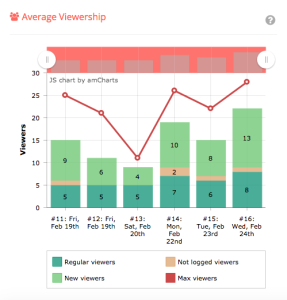
Now, my major favorite interactive data visualization is something I use on a daily basis. Stream Hatchet is a third party analytic system for Twitch streamers. You can use this to see everything from your average viewership to chat lines per session, amount of donations per session and more! If you’re live, you can see your data in real time. I use it, absolutely every day.
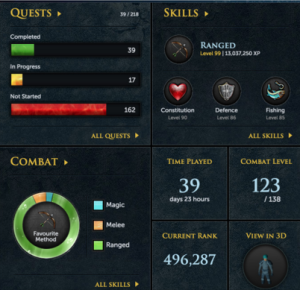
Something that not too many people recognize is that videogames are full of data visualizations. If it’s your health or mana, certain skills like strength or defence, all of that  is data visualization. Runescape actually does a great job of making your data really accessible offline as well as online. On their webpage, if you are a member you can create something called an “Adventurer’s Log” and you can see all of your characters stats any time you want to!
And even though they’ve got these nice pretty charts and graphs, keep in mind that while you’r playing the game, all of that too is data visualization. So seeing your health levels, where your opponents are on a map, or the amount of ammo you have, it’s all data visualization!
