When it comes to music – especially local music, I’m always out of the loop. I’ve been listening to the same bands for longer than I would like to admit, and I don’t tend to participate in many concerts or live shows. Besides, my musical tastes are pretty niche and I mainly enjoy video game soundtracks or remixes of classic midi tunes.
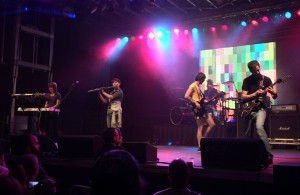
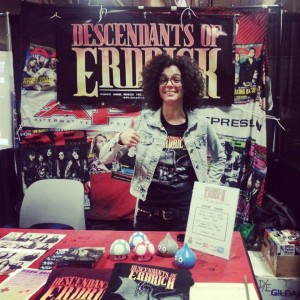
I’ve been following video game cover acts for sometime now, and have been surprised with the degree of the popularity a lot of these acts have received from their local regions. At times these bands can pull just as many people at their shows as typical musical acts, with nostalgia during performances at unique advantage. Throw in some clever merch opportunities or multimedia performances and costuming, and these acts are steadily growing in their underground communities.

For the project I thought it would be interesting to take several bands from several cities (Austin being the highlight) and track the number of followers on both Facebook and Twitter. I am interested in any correlation between what social platforms work well for these bands, the size of their communities compared to similar bands in other cities, and if there is any relation between the volume of software development studios in the area, quantity of acts or popularity that bands receive.
Software packages like Hootsuite and Sprout Social are fine for grabbing traditional analytics, though sometimes struggle with being incredibly up-to-date. Anything pulling from the last 24 hours seems to not be as accurate as some clients need.
So I thought it would be beneficial to find a way to pull the likes and follow numbers from multiple accounts and feed those directly in a graph. This could be useful for a client needing to keep track of several different numbers, but just wanting a quick overview of growth, needing to look at a comparison to other competitors, or sort by particular locations. The main idea was to be able to take the social analytic data and have it be able to present itself to the client without need for a separate report, logging into multiple accounts, or digging through an abundance of unnecessary social data could be useful when dealing with a campaign.
However when looking at the FB and Twitter APIs and trying to figure out how I can scrape the data and code it into the page, I realized I might going over my head as far as what I could manage in the time frame and with my current skill level.
I spoke with a friend about the relevance of data and whether or not it was even worth implementing Facebook and Twitter APIs in order to pull real-time data into the graph. Realizing that scraping this data would be over my head and a bit too ambitious for the time being, I decided that the social data for bands of this size doesn’t typically grow at an exponential rate, so live tracking for these purpose might be unnecessary. However, in the future, pulling data live from the source would be ideal.

I started looking at the four main areas I was wanting to explore (Austin, San Francisco/LA, Seattle, and NY) and started collecting the social media data for the largest bands I could find in these areas. Fortunately the nature of the data was pretty straight forward, cut and dry.
I then thought about how I would want to display this data and sketched out a several ideas while narrowing down some of the key features and interactivity functions I knew would be relevant and beneficial. Then started looking at existing resources and code that would closely maintain the look and display I wanted.
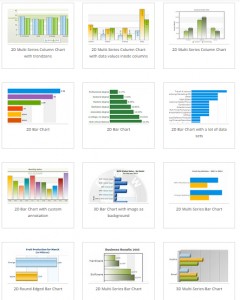
The JSON resources I’ve found from FusionCharts (http://www.fusioncharts.com/explore/column-bar-charts/) seem to be useful and pretty easy to manipulate by simply copy/pasting the code that you need.
Challenges and hurdles I will need to cross are getting multiple bars to appear when new areas are selected from the drop down menu, as well as having the bars link out directly to the connecting Facebook and Twitter pages.
I’m plan to update the group more as I wrap up the data project, and look forward to hearing your thoughts in class and learning about the discoveries, methods and tools that have worked best for you.