For my project, which can be seen here, I decided to work with some Twitter data about a show I’ve recently become obsessed with: RuPaul’s Drag Race. One of the most intriguing aspects of the show for me has been learning about the different styles of drag that are represented on the show. I’ve found it quite interesting to observe which drag styles are the most awarded.
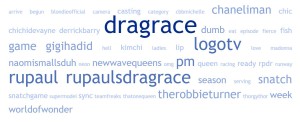
There is currentl y a season of the show airing so I decided to look at tweets about the current season to see who the most discussed contestants are. I took a high level of discussion to signify buzz and likelihood of being a strong contender for the win. I followed the procedures we practiced in class last week and made a word cloud, which is included on the website.
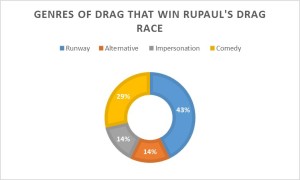
I also made a donut chart representing which styles of drag have been practiced by the winning queens to visualize the show’s preferences when it comes to drag styles. I made an area on the site where people can vote for which of the three most-discussed queens they think is most likely to win the competition. Upon submitting a vote, a user will see an updated donut chart that shows what the new breakdown of preference for drag styles will be if they are correct.
