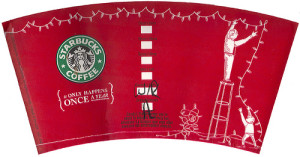
 For my second Project, my data studies the infamous red cup at Starbucks!
As autumn settles in, Starbucks is launching their seasonal red cups, marking the long- awaited return of holiday beverages. Finally, the infamous Peppermint Mocha is back! According to Starbucks, the tradition of the red cup has been highly anticipated since the introduction of the Christmas Blend in 1984. In 2014, the company reported a holiday cup being shared on Instagram every 14 seconds. Now that’s a lot of coffee! Instagram sharing is encouraged by the annual Red Cup Contest, which has customers snap a photo and tag it #redcupcontest for a chance at a Starbucks eGift Card.
For this data, I decided to be more specific and take a look at how many times variations of the tags #RedCup and #RedCups is used within one hour. Close to 700 tweets came in around 11 p.m. alone, I guess everyone needs their red cup!
You can take a look at my data on this page. Each bar represents five (5) minutes, coming out to ten for each set of bars.
UPDATE 11.10.15: I noticed the chart was not readable on certain size devices. I’ve discovered that, for Chart.js files, going into the provided chart.js file and writing “maintainAspectRatio: false” allows the chart to follow the responsive feature on Bootstrap and preserve readability.