The growth of Central Texas absolutely astonished me when I moved here from east Texas. So, I looked at census records to compare the growth of my hometown county and its surrounding counties and the counties I live near now. I manipulated the data by adding a filter for Texas and hiding the extra columns of information. While I was just looking at population estimates and increases over time, I may want to go back and look at birth/death rates, migration, etc. Hiding the columns allowed me to work with the data easily without completely trashing ever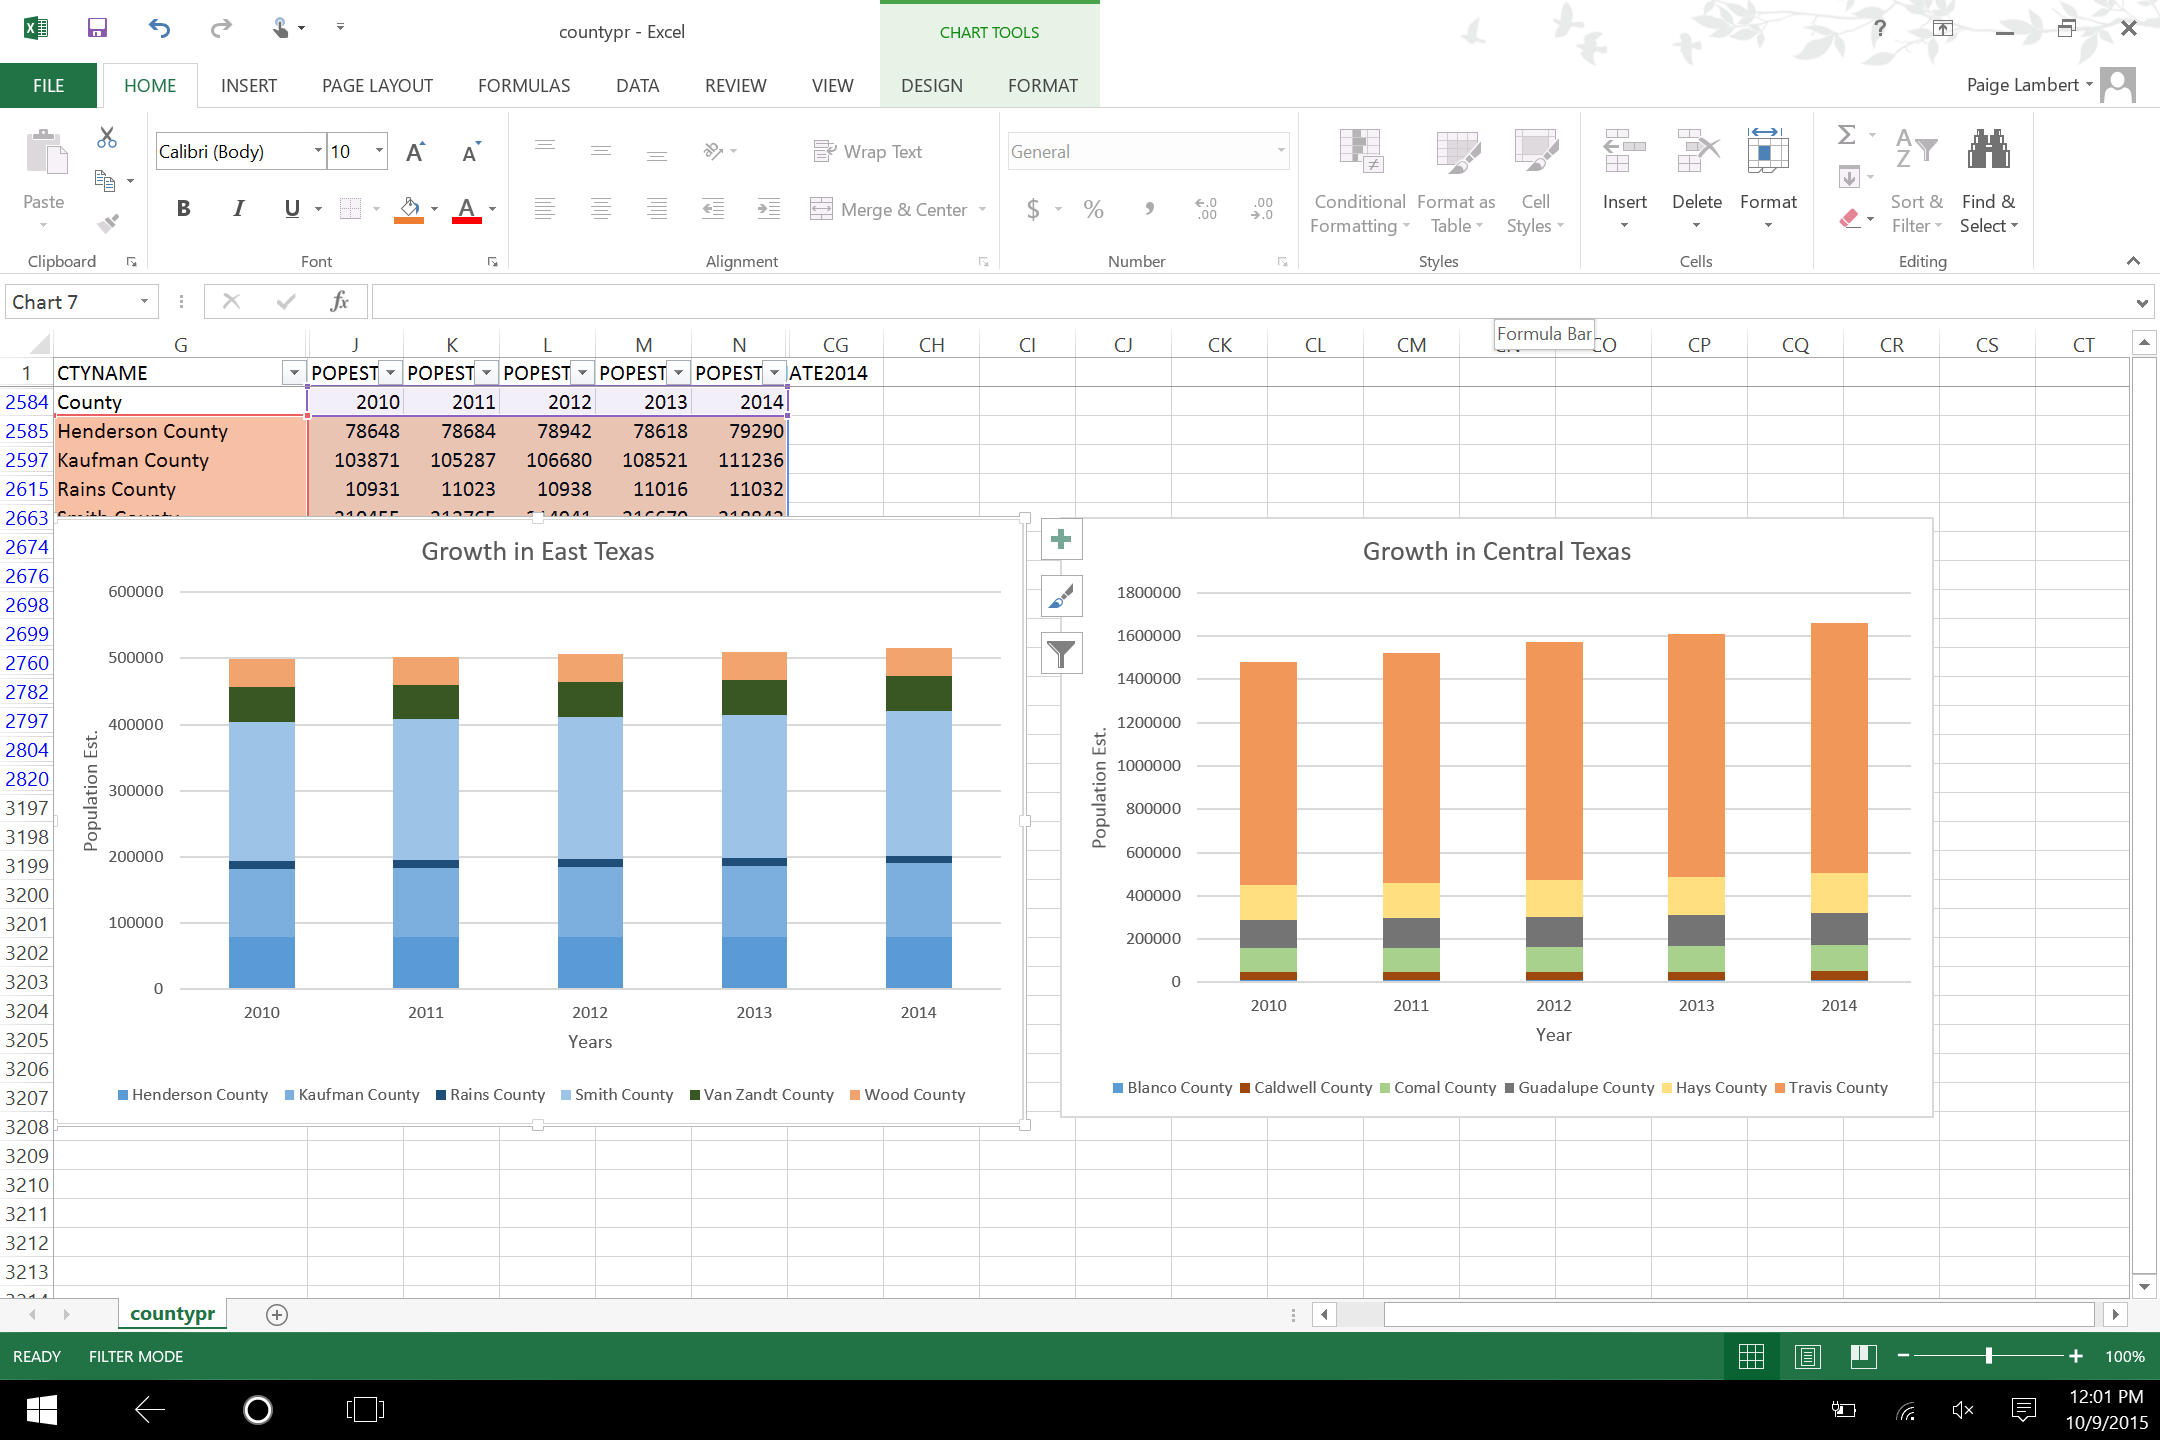 ything.
I hid the counties I didn’t need and color coded the others to easily sort and select the information for the right table. Here I came across some issues with headings and placement of the data. Some of the charts would work for some of the information while others would not. I finally selected a stacked chart to compare both sets of data.
I’m still getting used to my PC, but there is a bigger screenshot below. What I found was the majority of Central Texas counties where growing at a good pace, while the east Texas counties were stagnant! Rains and Van Zandt even decreased in 2012. Its interesting though that Wood County is has the largest population and growth increase.
The growth rate for certain regions can play into the way of life for that area and how progressive the culture is. East Texas is more laid back and traditional while central Texas overall is progressive, ever-changing and has become to hub of change in many aspects.