Skip to content

Coding and Data Skills

For Communicators

Menu

  • Home
  • Outline
  • Syllabus
  • Assignments
  • Tutorials
    • HTML Forms and Form Processing
    • JavaScript Tutorials
    • Git and GitHub
    • Spreadsheet Tutorials
    • API Tutorials
    • Charting Tutorials
    • News App Tutorial
  • Student Work
  • Resources
  • Contact

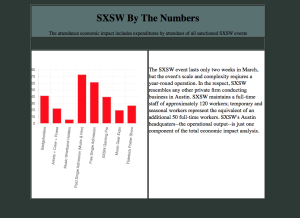
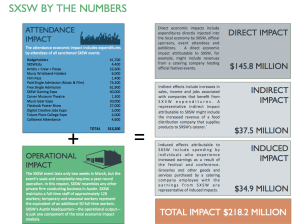
For this assignment, I chose to use some of the static’s that SXSW posted for their 2014 year. I used a javascript for the bar chart to make it interactive..all the info posted in the chart can be found here.


Go to the chart by clicking here.

 More information here.

Screen Shot 2014-12-15 at 9.20.16 AMScreen Shot 2014-12-15 at 9.53.30 AM

Thomas Hodge November 10, 2014December 15, 2014 Uncategorized
  • ← Final Project Idea
  • Brainstorming the Project →
Copyright © 2025 Coding and Data Skills. Powered by WordPress. Theme: Spacious by ThemeGrill.